

The Bullish Harami is multiple candlestick chart pattern which is formed after a downtrend indicating bullish reversal.
It consists of two candlestick charts, the first candlestick being a tall bearish candle and second being a small bullish candle which should be in the range of the first candlestick.
The first bearish candle shows the continuation of the bearish trend and the second candle shows that the bulls are back in the market. Traders can take a long position after the completion of this candlestick pattern.
The name “Harami” comes from Japanese and means pregnant due to the fact that the formation is similar in appearance to a pregnant woman. There are two types of Harami candle patterns, the bullish and bearish harami candlestick pattern.
The only difference is that the bearish harami pattern appears at the end of an uptrend and has the opposite outcome that the bullish harami setup.
How to Identify Bullish Harami Candlestick Pattern over a chart?
If you are an investor and just starting with the Bullish harami pattern, then you should first look for the market performance every day and make sure that you also know the market for the last few days.
The harami candle pattern looks over for two or more days of trading, while the bullish depends on the initial candles, which sees the downward price.
Don’t worry if you see this bullish pattern differently on your stock chart; the tactics and the identification methods are completely the same.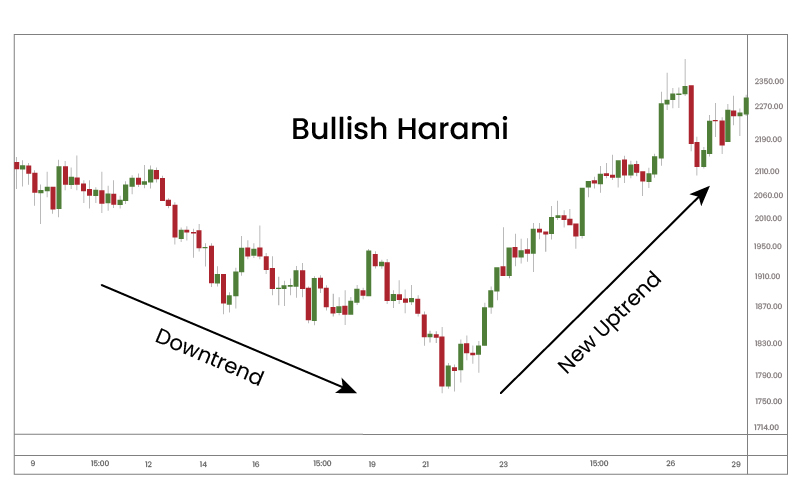
Bullish Harami Candlestick Chart Identification Process
- Look for the existing downtrend.
- You might get signals about trends slowing or reversing, wait for it- it will be candles moving in a crossover, or constant bullish pattern formations, or downward trend.
- Now, ensure that the small green body candle is no more than 25% of the previous candle on the chart. If the stocks are gaping up or high, then the green candle will go mid-way up than the previous candle or the bar.
- Keep in mind, when it is about the forex charts, then the candles will show side by side, not too high or low.
- The real bullish candle will be seen enclosed in the length of the previous candle in the chart.
- You can also take help and support from the indicators and the levels.
How does Bullish Harami Pattern work?
Firstly, there are two types of candlestick in the pattern:
- Small candle
- Larger candle
The pattern is either bearish or bullish. We will here talk about the bullish harami pattern.
This particular pattern appears when there is a huge bearish red candle on day 1, followed by different small candles on day 2. Remember, the candlestick and trend follow for more than two days.
That’s exactly what it does! The bullish pattern gap up the price on the second day and don’t become bearish nearing day 1.
For the bullish to appear, a small candle body will close much higher than the previous body, which signals the reverse market.
How to trade using Bullish Harami Candlestick Pattern?
Market Condition
Volatile stocks that have high beta values form bullish pattern, in general. You, as an investor, should select the most suitable stocks or indices. The selected price margin should be high and should breach the second bearish candle.
Only such a move will result in profit. However, there are limitations with such a trading method; hence, you may choose the stop-loss method.
Stop-Loss Limit
Now method differs from every trader to trader that also depends on their trading preferences. However, if you are going long, you can set the stop-loss proportion at 3 units below the candle’s lowest price.
If you are entering the high price, then you should be ready for the risk as well. For beginners, it is suggested to keep it low.
Trade Entry
Now, you know that the downtrend usually takes the reversal, and the prices will fall in the future. Hence, you can take up a low price for a long position, as usual.
Otherwise, you can also wait for a little longer and then take up the high price, as the profits will kick in soon. You have to plan strategically and with much patience!
Is Bullish Harami Candlestick Reliable?
Yes, it is! It is one of the most reliable candlestick pattern that are suitable both for beginners and experts.
It comes with opposite combinations supporting various interpretations. The long black stick closes on the low along with a short and white candlestick.
It is read as the market was in complete control on the first day and halted the selling movements on the second day, suggesting that the market might follow the downtrend for a while. This pattern is reliable and trustworthy!
You can also use the candlestick pattern and other pattern such as Bollinger bands, which would make it a perfect combination and the easiest to understand for beginners.
Conclusion – Bullish Harami Candlestick Pattern
Don’t be concerned if you are a beginner. Every investor has started as a beginner, and the fact is that Japanese candlestick are far easier than other trading pattern.
You can use the Bullish harami candlestick pattern, which would be great, and you have to gauge both the opening position and closing position for better understanding, and always keep an eye on previous day market positions.
By ~ Capital Varsity