Commodity trading is where various commodities and their derivatives products are bought and sold. A commodity is any staple or primary agricultural product that can be bought or sold, whether wheat, gold, or petroleum, among many others. once you engage in commodity trading, such commodities can diversify your asset portfolio. Commodity trading is broadly classified...Read More
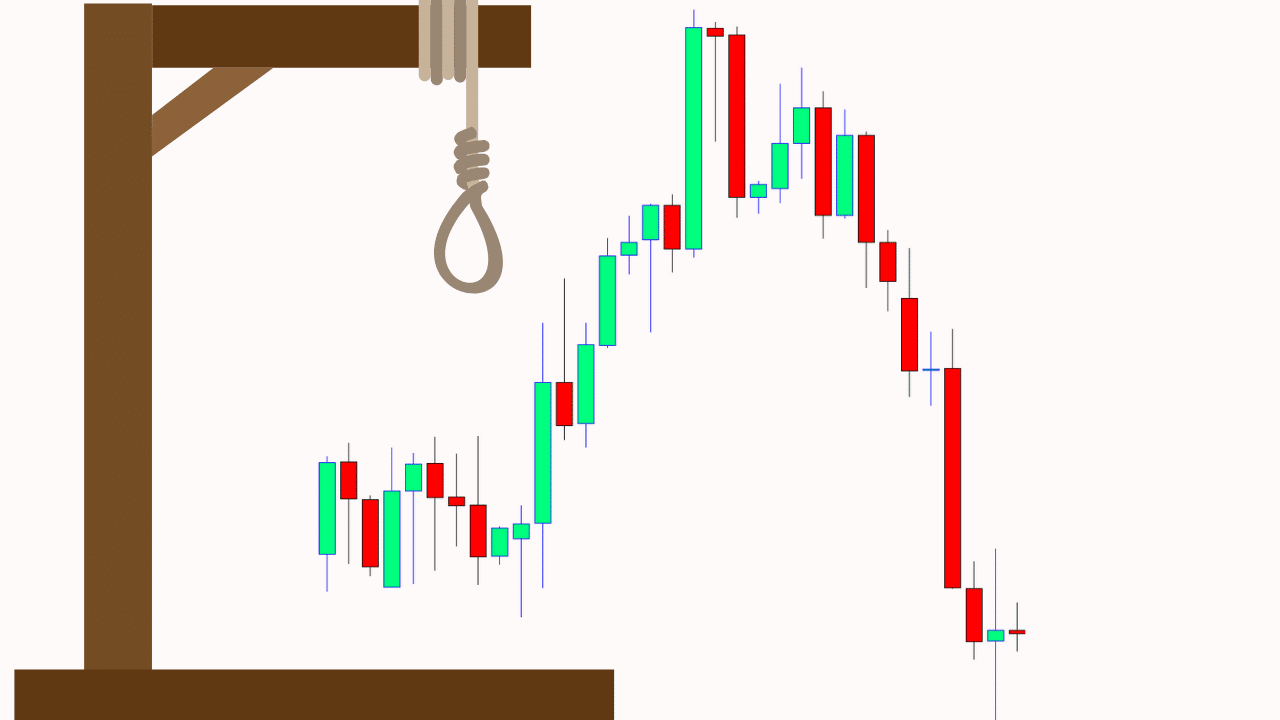
The Hanging Man candlestick pattern, as one could predict from the name, is viewed as a bearish reversal pattern. This pattern occurs mainly at the top of uptrends and can act as a warning of a potential reversal downward. What happens on the next day after the Hanging Man pattern is what gives traders an...Read More
The on neck pattern occurs after a downtrend when a long real bodied bearish candle is followed by a smaller real bodied bullish candle which gaps down on the open but then closes near the prior candle’s close. The bears are in control of the market, and they continue their dominance with the On Neck...Read More
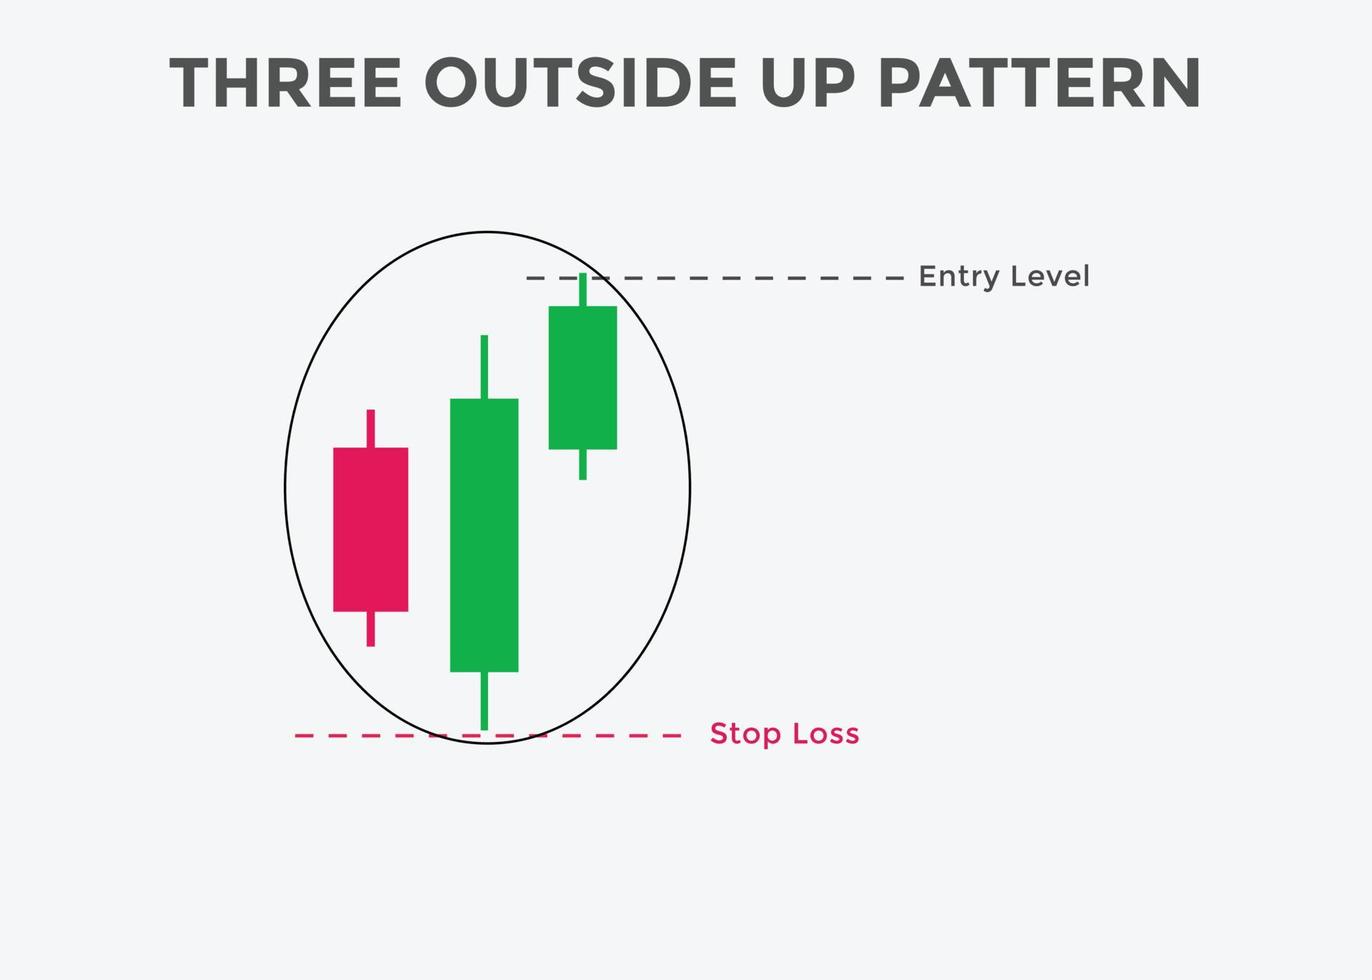
The Three Outside Up is multiple candlestick pattern which is formed after a downtrend indicating bullish reversal. It consists of three candlesticks, the first being a short bearish candle, the second candlestick being a large bullish candle which should cover the first candlestick. The third candlestick should be a long bullish candlestick confirming the bullish...Read More
The Bullish Harami is multiple candlestick chart pattern which is formed after a downtrend indicating bullish reversal. It consists of two candlestick charts, the first candlestick being a tall bearish candle and second being a small bullish candle which should be in the range of the first candlestick. The first bearish candle shows the continuation...Read More
The Three Inside Up is multiple candlestick pattern which is formed after a downtrend indicating bullish reversal. It consists of three candlesticks, the first being a long bearish candle, the second candlestick being a small bullish candle which should be in the range the first candlestick. The third candlestick should be a long bullish candlestick...Read More
The White Marubozu is a single candlestick pattern that is formed after a downtrend indicating a bullish reversal. This candlestick has a long bullish body with no upper or lower shadows which shows that the bulls are exerting buying pressure and the markets may turn bullish.At the formation of this candle, the sellers should be...Read More
Candlestick charts originated in Japan over 100 years before the West had developed the bar charts and point-and-figure charts. In the 1700s, a Japanese man known as Homma discovered that as there was a link between price and the supply and demand of rice, the markets also were strongly influenced by the emotions of traders....Read More
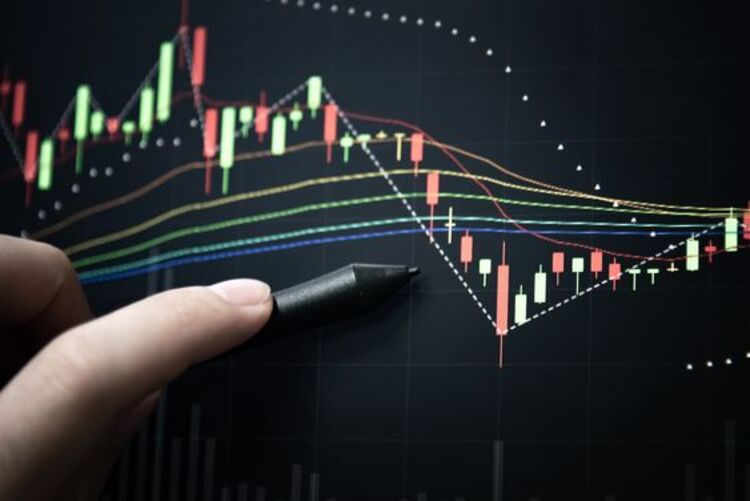
When trading the financial markets, there are hundreds of different technical indicators to use on your charts, and selecting the proper ones for your trading style and plan is critical. The two forms of market analysis – fundamental and technical analysis – are among the first and most significant things Forex traders must learn and...Read More
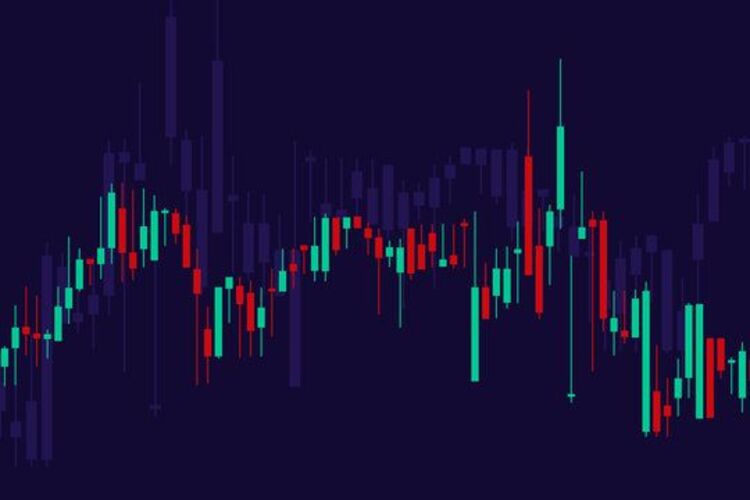
Forex day trading is popularly thought of as a means to earn a rapid profit on your money, but it is not for everyone. Before you go into this form of trading, there are a few things you should think about. Forex day trading, like any other trading method, comes with its own set of...Read More


")

Recent Comments