1.1 Foreign exchange (Forex/FX) market
Foreign exchange trading is the exchange of one currency of a country with another. The foreign exchange market is formed by banks around the world quoting and dealing among them round the clock every day. It is now part of everyday lives among individuals and countries. The average daily trading volume of International Foreign Exchange Markets is around US $ 4 trillion.
I think want to know more about the Forex Market? So Free Enroll in Forex Market Courses Now.
1.2 Major participants in FX markets
The participants of Foreign Exchange Markets include central banks, commercial banks, non-bank financial institutions, brokers, traders and large multinational enterprises. They perform frequent trades, with transactions in millions and tenth millions US dollars. Participants can also be classified as either investors or speculators based on their trading objectives.
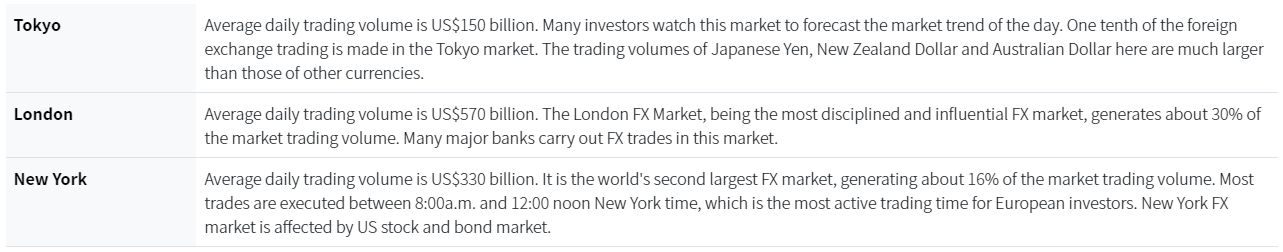
1.3 World’s largest foreign exchange centres
There are around 30 foreign exchange markets in the world, spreading throughout different countries and regions within all continents. Traditionally they are Asia-Pacific, Europe and North America regions. The major foreign exchange markets are London, Frankfurt, Zurich and Paris in Europe, New York and Los Angeles in North America and Sydney, Tokyo, Singapore and Hong Kong in Asia-Pacific.
London is the world’s largest FX trading centre. As the eldest International Financial Centre, London has also the longest history in FX market. The market started its formation before the World War I. In October 1979, foreign exchange controls were completely lifted in London, FX market there was then under rapid development. With around 600 banks having their headquarters and branches in the city, London has a very active FX market.
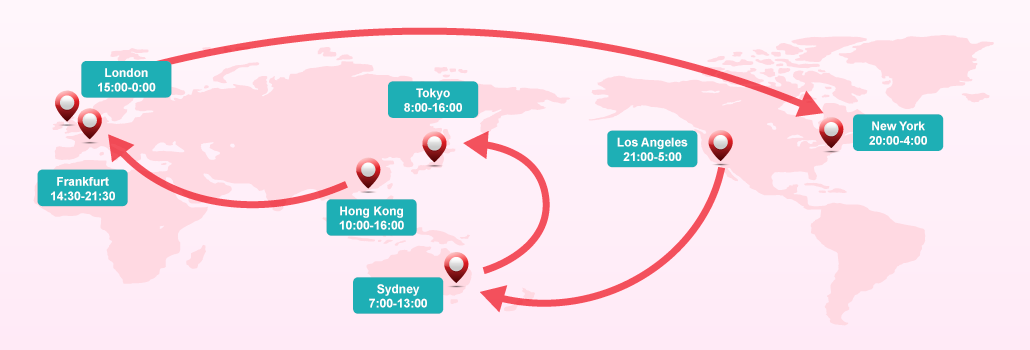
Due to the unique geographical location of London which connecting the Asian and North American markets: London market opens when Asian markets closes, and it closes when New York market opens; trading is extremely active during this period, and this makes London the world’s largest FX trading centre and it has significant impact to the FX market trend.
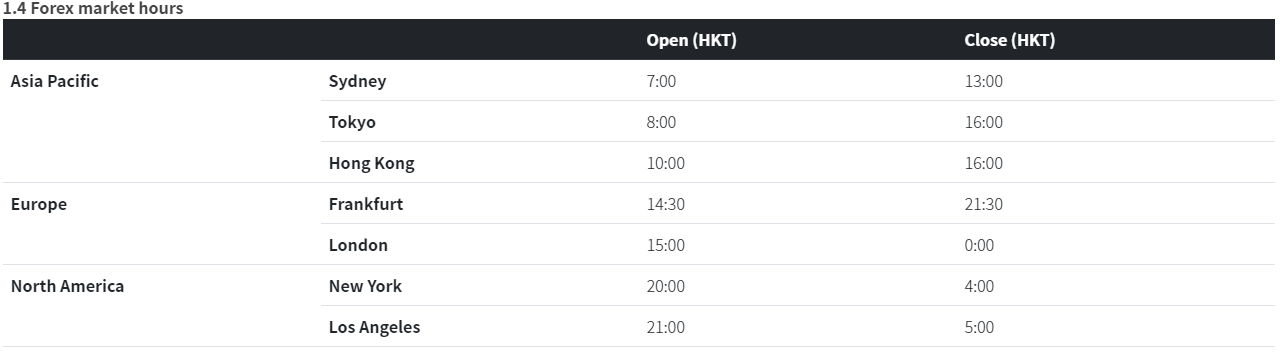
Due to the different geographical locations and time zones among all financial centres in the world, the foreign exchange markets operate 24 hours non-stop daily, thus forming a colossal market. The foreign exchange markets in Wellington, Sydney, Tokyo, Hong Kong, Frankfurt, London, and New York, etc. are closely interlinked, providing investors with an investment platform without time and space limitation. FX markets are only closed on Saturdays, Sundays and at important national festivals of respective countries.
High volatility, no up or down-limit, transparency and low possibility of manipulation and insider trading make the FX market participants not limited to people with practical use, but also involve investors.
Notes: Above market hours are shown in Hong Kong time.
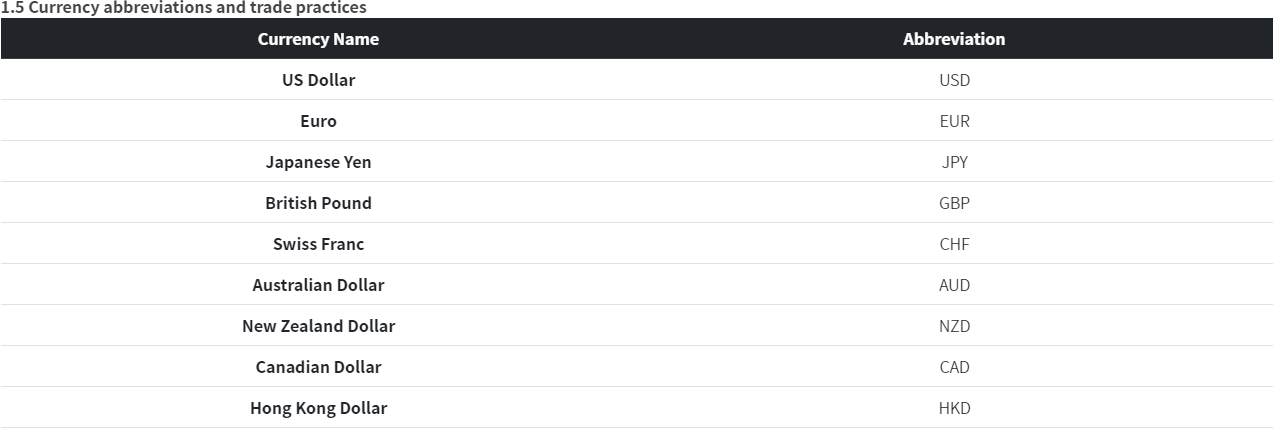
Prices in forex trading are quoted in currency pairs. e.g. Euro versus US Dollar (EUR/USD), US Dollar versus Japanese Yen (USD/JPY), British Pound versus US Dollar (GBP/USD), etc. The first currency quoted in a currency pair is known as the “Base Currency”, whereas the second one is known as the “Quoted Currency”. A FX price represents how much of the quoted currency is required for exchanging one unit of base currency. For example, if you expect Euro, compared to US dollar, will appreciate, then you will buy EUR/USD, which means you are buying Euro (meanwhile selling US dollar). If you expect Euro will depreciate, then you will sell EUR/USD (which means selling Euro and buying US dollar).
1.6 Forex quotes
Direct quotes
Also known as “Price Quotation in U.S. Terms”.
Direct quotes are used on British Pound (GBP), Euro (EUR), Australian Dollar (AUD), New Zealand Dollar (NZD) forex trading.
It is quoted as the number of unit of US Dollar per unit of foreign currency.
i.e. 1 British Pound = 1.3200 US Dollar, 1 Australian Dollar = 0.7000 US Dollar.
Indirect quotes
Also known as “Volume Quotation in European Terms”.
It is a foreign exchange rate quoted as the number of unit of foreign currency per unit of the domestic currency
i.e. 1 US Dollar = 0.9200 Swiss Franc, 1 US Dollar = 110.00 Japanese Yen
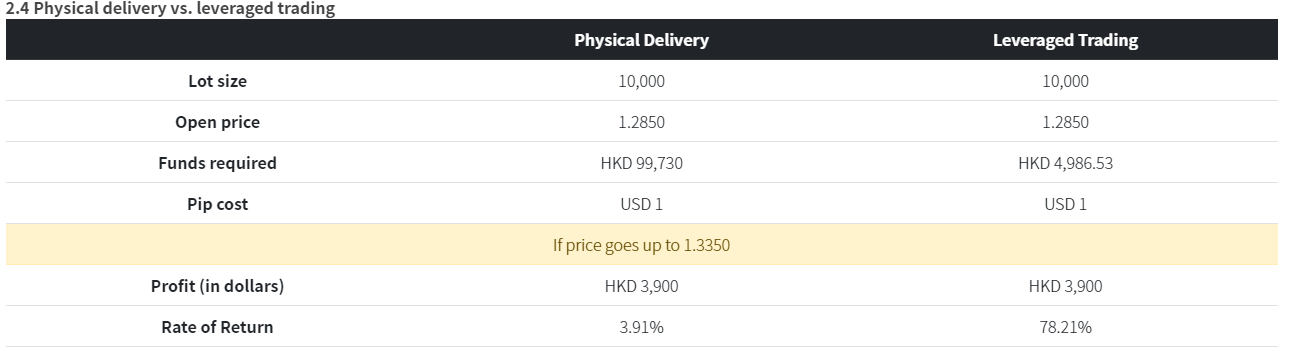
2.1 Forex margin requirements in Hong Kong
In forex trading, the margin requirement refers to a good faith deposit for possible trading loss on opened positions. The margin allows traders to participate in leveraged trade, and hold positions greater than the margin deposit value. The Hong Kong margin level is 5% of the open position value, which is 1:20 leverage, the maximum allowed by the SFC regulations.
Learn more about margins.
2.2 What is Spreads?
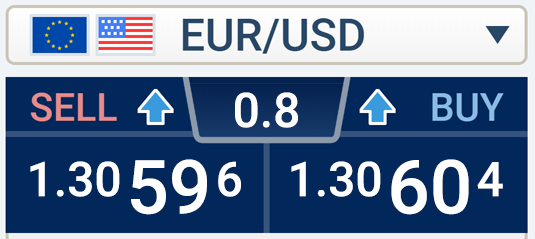
Spread refers to the difference between the sell and buy price of a two-way price quote. In forex trading, the spread is the transaction cost for the investors. (Some brokers may apply charges on clients e.g. commission and service charges apart from spread).
In this example of EUR/USD, a quote of sell price 1.30596 versus buy price 1.30604, (1.30604 – 1.30596 = 0.8) 0.8 is the price spread. For every 1 lot (equivalent to 10,000 EUR) traded for EUR/USD, each pip change in value is worth 1 USD of profit or loss on your trading account.
Learn more about our spreads.
2.3 Rollover interest
If investor holds position more than one trading day, they may earn or pay the rollover interest rate, which is based on the interest rate difference between the currency pairs they are trading.
Learn more about our rollover policy.
3.1 Introduction to Fundamental Analysis
Fundamental Analysis Courses refers to the study of financial market and economic studies in attempt to predict the trend and value of currency fluctuations. The studied materials may include economic figures, news, rates trends and governmental policies. Contrary to technical analysis, technical analysis focuses solely on market factors in currency market trends when evaluating the price trends. In study of macroeconomics, it generally includes domestic and international economic indicators, such as Gross Domestic Product (GDP), inflation rate, interest rates etc., which may involve too much data and figures. It could lead to incomplete and uncertainties in data collection. Furthermore, news release so frequently and it takes time to investigate and gather up information. By the time the results are ready, it may have already outdated and deviated. Thus, it is necessary to combine the use of Fundamental Analysis Courses and Technical Analysis Courses.
3.2 Interest rates
Interest rate is one the major factors that affects a country’s currency, basically because it provides income for investors. It is logical for investors to hold a currency that brings in the highest possible interest. For example, if 1 year fixed deposit rate of Australian Dollar is 3.5% and 0.25% for the US Dollar, rational investors will tend to hold AUD and sell USD.
Furthermore, interest rate change anticipation also plays a major role in currency fluctuations. An appreciation of AUD could be expected when the interest rate spread between AUD and USD widens, and vice versa.
4.1 Introduction to technical analysis
The technical analysis is the study of financial markets in the past (the use of the chart) to predict the price trend and decided the use of investment strategies. In theory, technical analysis only considers the behaviour of the market or the real price of the financial instruments. By assumption, the premise to assume that its price will reflect all investors via other channels with all relevant factors studies.
The basic beliefs of the technical analysis are built on “History will repeat itself endlessly” and uses statistical datasets to predict the market moment. Technical analysis is widely used by traders and financial experts most of the time. Some researches state that the use of technical analysis is more extensive compared to fundamental analysis in the foreign exchange market.
4.2 Support line
Support Line is considered as the level at which a lot of buyers tend to enter the market. Often referred to as the “support level”. In the uptrend, a trend line is drawn through the lowest swing-points of the price move. Connecting at least two “lowest lows” will create a trend line. A trend line confirms its validity when the price respects this line. The more “lowest lows” the trend line contains, the more reliable it is. When the price drops down to the support level, there may be a pressure that prevent it for further decrease. Therefore, by investigating the support level, an optimal buy-in price could be found.
4.3 Resistance line
In the uptrend, a trend lines is drawn through the highest swing-points of the price move. Connecting at least two “highest highs” will create a trend line. The more times that the price has tried unsuccessfully to break through the resistance level, the more formidable that area of resistance becomes. When the price increases up to the resistance level, there may be a pressure that prevent it for further increase. Generally, resistance level is viewed as a selling signal.
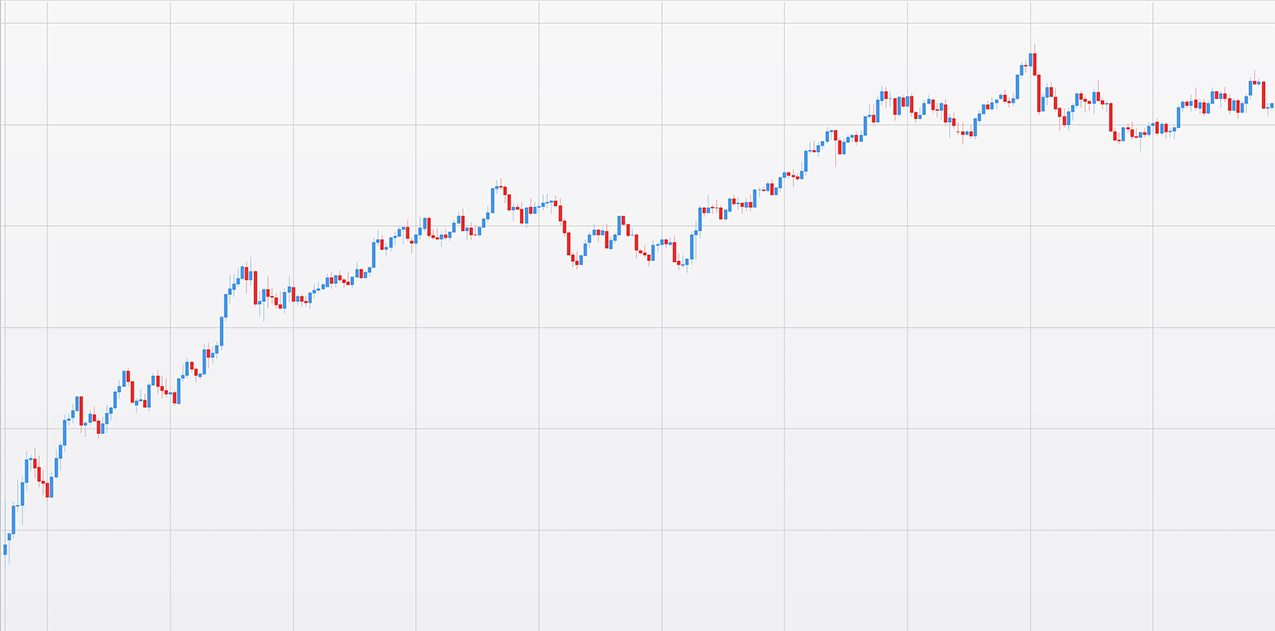
4.4 Uptrend
Describes the price movement of a financial asset when the overall direction is upward. A formal uptrend is when each successive peak and trough is higher than the ones found earlier in the trend. Notice how each successive peak and trough is located above the previous ones. There are buying signals at each trough. Plotting a trend line on a Forex chart gives very valuable information. Not only the trend line will show a current trend of the price move, it will also depict points of support and resistance levels for market price. In addition, it will also help to determine good entry and exit points, best positioning for profit taking and placing protective stops. This is very simple but relatively powerful tool that will be viewed as one of the crucial indicators of possible trend reversal.
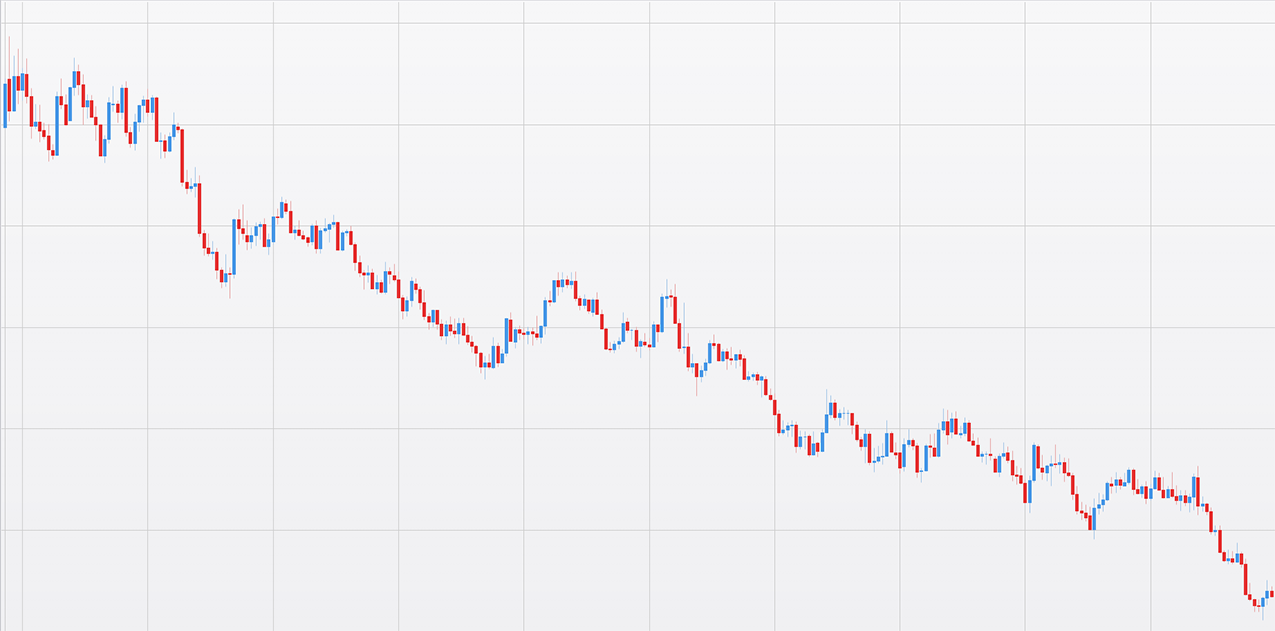
4.5 Downtrend
Describes the price movement of a financial asset when the overall direction is downward. A formal downtrend occurs when each successive peak and trough is lower than the ones found earlier in the trend. Notice how each successive peak and trough is lower than the previous one.