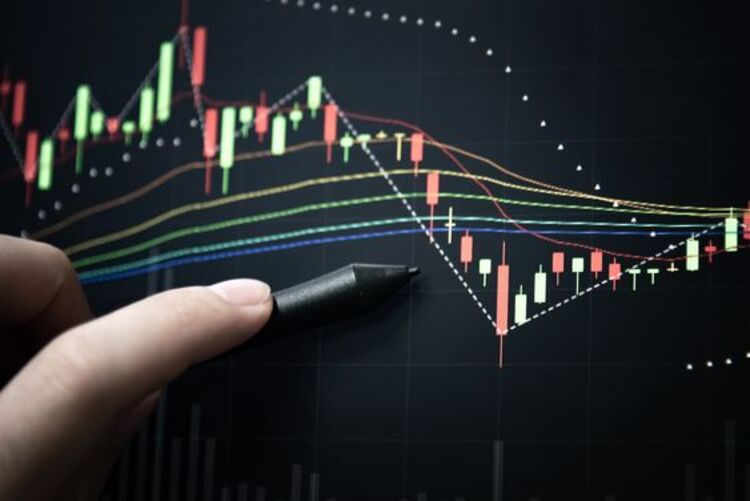
When trading the financial markets, there are hundreds of different technical indicators to use on your charts, and selecting the proper ones for your trading style and plan is critical.
The two forms of market analysis – fundamental and technical analysis – are among the first and most significant things Forex traders must learn and understand. Even though the two methods of analysis are not mutually exclusive, most traders will fall into one of them. Fundamental and technical analysis both have their own set of benefits and drawbacks. Technical analysis is known as the method of analyzing charts and patterns to forecast how prices will change.
What are technical indicators in forex?
Technical indicators are mathematical instruments that look at one of the five numbers listed above: open price, high, low, closing price, and volume. Technical indicators are graphically shown as chart patterns as a consequence of the computation. They can be drawn in a separate window or overlaid on top of the price chart.
Another thing to bear in mind is that the bulk of technical indicators was created long before the internet and were intended for stock or commodity markets with long timeframes – since trading charts were updated every 24 hours at the time.
Advantages of using Technical indicators in Forex
Technical analysis is known as the method of analyzing charts and patterns to forecast how prices will change. Technical trading has a long history and is founded on the premise that history tends to repeat itself.
As a result, when certain patterns and signs emerge, prices are quite likely to move in a particular way. A technical trader, in essence, uses the framework offered to make well-informed judgments on whether to enter or quit a trade. The framework aids technical traders in analyzing current price movement and comparing it to similar events in the past. Here are some Advantages of Technical indicators in forex:-
- By examining the direction and intensity of trends, technical analysis may be completed fast.
- Technical analysis may be used on any trading instrument and in any period (long, medium, or short, ranging from minutes to years).
- It is utilized not just in the currency market to analyze currencies, but also in the stock, commodity, and interest rate sectors.
- It can be employed as a stand-alone market analysis method or in conjunction with fundamental research or other market timing strategies.
- Traders can employ tools that are currently accessible and locate prospective trading opportunities by using popular technical indicators.
- Technical analysis allows us to view a large amount of organized data on our screen, which gives traders a sense of control.
Types of Technical Indicators in Forex
- Stochastic Indicator
George Lane invented the Stochastic Indicator. It’s a very valuable technical indicator that tells traders when a trend is about to terminate. It uses a scale to assess the degree of change in prices from one closing period to the next to forecast how long the present trend will last.
The premise behind the Stochastic Indicator is that:
1) in an uptrend, prices will remain equal to or above the previous period’s closing price.
2) in a downtrend, prices will remain equal to or below the previous period’s closing price.
- Ichimoku Cloud
Ichimoku Cloud, also known as Ichimoku Kinko Hyo or Kumo Cloud, is a forex indicator that separates high-probability transactions.
Although this indication is relatively new to traders, its popularity has grown in recent years, particularly among inexperienced traders. The Ichimoku cloud displays more data points, allowing for more accurate price analysis.
Ichimoku Kinko Hyo is a system that combines lines on a chart to calculate future price momentum. It also affects future areas of support and opposition. To many, it appears to be a complicated sign, owing to the several lines and their distinct meanings.
- Moving Average Convergence Divergence (MACD)
Indicator Gerald Appel developed this technical indicator in the late 1970s. It’s used to spot moving averages that signal the start of a new trend, whether bullish or bearish. The ability to recognize a trend is critical for traders since it is how they generate money.
The MACD indicator depicts the connection between two moving averages of the price of an asset. Traders may observe three separate figures on the MACD chart:
1) the periods used to create the faster moving average;
2) the periods used to produce the slower moving average, and
3) the number of bars used to calculate the MA of the difference between the slower and faster moving averages.
- Commodity Channel Index (CCI) Indicator
The CCI indicator is used to calculate the difference between an asset’s current price and its historical average price. When the CCI is above zero, it indicates that the price is above the historic average, whereas when it is below zero, it indicates that the price is below the historic average.
- Average true range
The Average True Range (ATR) is a volatility indicator that shows how much an asset moves on average over a certain period.
It was created by J. Welles Wilder to assess the volatility of price fluctuations in the commodities market, but it is now frequently utilized by forex traders since volatility is so prominent in the forex market. As price variations in an asset become greater or smaller, the ATR indicator rises up or down. The 14-day moving average of a series of true range indicators is commonly used to calculate the ATR indicator. Day traders may utilize the indicator in a variety of ways, such as a trailing stop loss.
It’s vital to realize that the ATR indicator won’t tell you which way the trend is going. It can, however, help you with your trading strategy if you follow the rule that high volatility follows low volatility and vice versa.
This information can help you spot breakthrough trades before they happen. When a market instrument approaches low volatility.
Traders may readily be warned when favorable conditions exist by utilizing technical indicators, allowing them to make better, more logical, and well-calculated judgments.
Technical analysis indicators are used by many traders and investors to help them discover trends and achieve good outcomes. Traders can use technical analysis indicators to determine the direction and intensity of trends.
Traders don’t always rely on just one indication. Most of the time, they combine a major indication with two or more secondary indicators to get stronger confirmation and come out on top.
Keep in mind that each of the indicators has its own set of advantages, and technical traders use them frequently. if you’re interested in becoming a professional trader and learning more about the benefits of technical analysis then you can enroll in the Capital Varsity Forex Trading course where we teach traders about technical analysis and provide solid foundations.