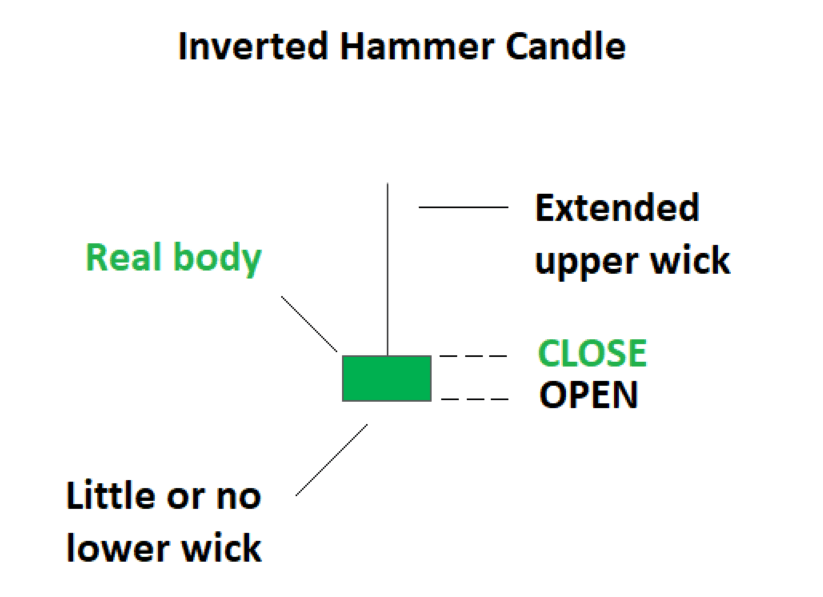
An Inverted Hammer is formed at the end of the downtrend and gives a bullish reversal signal.
This pattern is formed when the opening and closing prices are near to each other and the upper shadow should be more than twice the real body.
An Inverted H
Knowing how to spot possible reversals when trading can help you maximize your opportunities. The inverted hammer candlestick pattern is one such signal that can help you identify new trends.
What does an inverted hammer tell traders?
An inverted hammer tells traders that buyers are putting pressure on the market. It warns that there could be a price reversal following a bearish trend. It’s important to remember that the inverted hammer candlestick shouldn’t be viewed in isolation – always confirm any possible signals with additional formations or technical indicators. Lastly, consult your trading plan before acting on the inverted hammer.
How to trade when you see the inverted hammer candlestick pattern
To trade when you see the inverted hammer candlestick pattern, start by looking for other signals that confirm the possible reversal. If you believe that it will occur, you can trade via CFDs or spread bets. These are derivative products, which means you can trade on both rising and falling prices.
To trade an uptrend, you can ‘buy’ (go long). If you think that the signal is not strong enough and the downtrend will continue, you can ‘sell’ (go short
When we start analyzing the stocks using this inverted hammer candlestick pattern, there are certain aspects that we should look for.
Below are a few aspects which will help you in trading with an inverted hammer candlestick pattern:
- Confirm the pattern:
There are certain confirmation criteria that traders should consider when taking the trade using an Inverted Hammer candlestick.
If the formation of Inverted Hammers occurs with a gap down from the previous day’s candlestick, then the chances of reversal are stronger.
The volume in trading should be high on the day of the formation of the Inverted Hammer candlestick pattern. High volume signifies that buyers have entered the market and exert pressure to increase the price of the stock.
It is better to enter the buying position the next day if the price opens higher.
Before entering into the trade, the trader must consider the above criteria to confirm the bullish reversal signal given by the Inverted Hammer.
- The psychology behind the pattern:
The prior trend should be a downtrend which means that the prices should be making lower lows and there should be selling pressure exerted by the sellers to make the price fall.
When this candlestick forms, it shows that the bulls are back into the market and have started putting buying pressure to make the prices rise high and bears are unable to bring the price down.
If the price maintains its strength even in the next trading session, one can enter the buy position.
- Don’t get confused with other candlestick patterns:
Traders often get confused between the inverted hammer and shooting star candlestick pattern. But one should note that the inverted hammer occurs after the downtrend whereas shooting start happens after an uptrend.
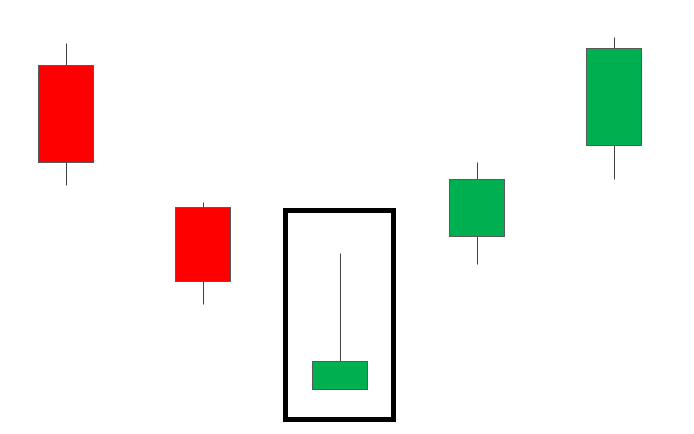
- Inverted Hammer reversal candlestick pattern which appears at the bottom of a downtrend and signals a potential bullish reversal.
- This candlestick pattern has a long shadow at the top and there is no shadow at the bottom.
- An inverted hammer candlestick pattern is formed when bullish traders start again to gain confidence after sellers have pushed the prices downwards.
- The volume should be high on the day of the formation of the Inverted Hammer candlestick pattern
- Confirm this signal with other technical indicators as it may sometimes fall signals.
By ~ Capital Varsity