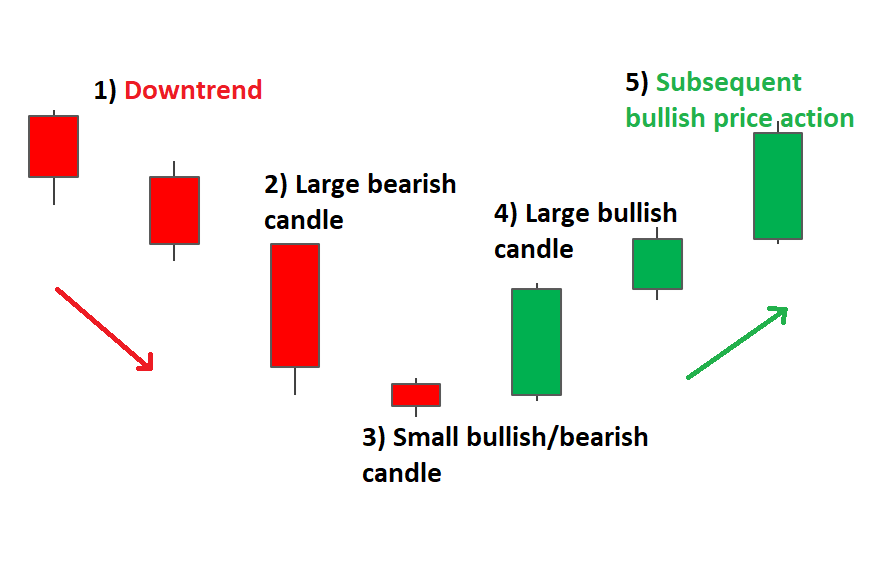
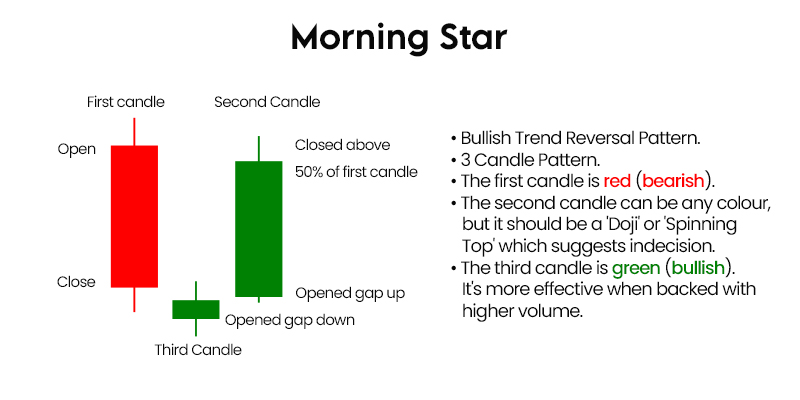
The Morning Star is a multiple candlestick chart pattern which is formed after a downtrend indicating a bullish reversal.
It is made of 3 candlesticks, the first being a bearish candle, the second a Doji and the third being a bullish candle.
The first candle shows the continuation of the downtrend. The second candle being a doji indicates indecision in the market. The third bullish candle shows that the bulls are back in the market and reversal will take place.
The second candle should be completely out of the real bodies of the first and third candles.
Traders can enter a long position if the next day a bullish candle is formed and can place a stop-loss at the low of the second candle.
Below is an example of the Morning Star Candlestick Charts Pattern:
Trading purely on visual patterns can be a risky proposition. A morning star is best when it is backed up by volume and some other indicator like a support level. Otherwise, it is very easy to see morning stars forming whenever a small candle pops up in a downtrend.
By ~ Capital Varsity

