
The Tweezer Bottom candlestick pattern is a bullish reversal candlestick pattern that is formed at the end of the downtrend.
It consists of two candlesticks, the first one being bearish and the second one being bullish candlestick.
Both the candlesticks make almost or the same low. When the Tweezer Bottom candlestick pattern is formed the prior trend is a downtrend.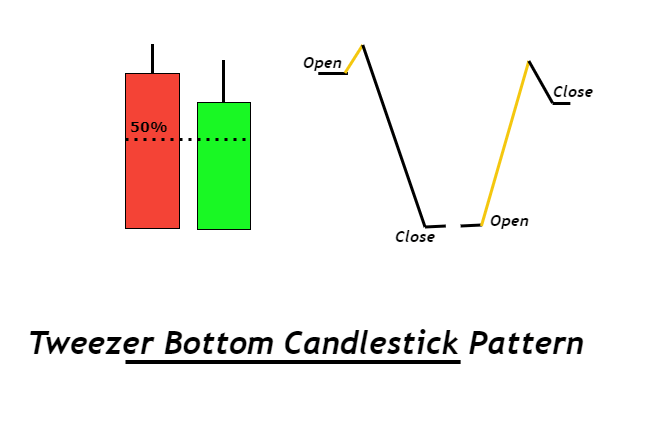
A bearish tweezer candlestick is formed which looks like the continuation of the ongoing downtrend. On the next day, the second day’s bullish candle’s low indicates a support level.
The bottom-most candles with almost the same low indicate the strength of the support and also signal that the downtrend may get reversed to form an uptrend. Due to this the bulls step into action and move the price upwards.
This bullish reversal is confirmed the next day when the bullish candle is formed.
The two candle’s lower shadows signify an area of support.
The bears were not willing to sell below that lowest price, so the bulls returned and overpowered the bears, pushing the price back up.
Since two or more candles formed shadows at this same level confirms the strength of the support and shows that the downtrend has likely paused or worse, has reversed into an uptrend.
Like the Tweezer Top, the Tweezer Bottom is viewed as a reversal pattern.
To better analyze a specific Tweezer Bottom, observe the following
1. If the Tweezer Bottom appears at market lows, it is more reliable.
2. If the first candle has a large body and the second has a short body, the reversal is more reliable.
3. If the Tweezer Bottom is followed by another reversal pattern, such as a Bullish Engulfing or Piercing
Line pattern, with identical lows, is even more reliable.
By ~ Capital Varsity