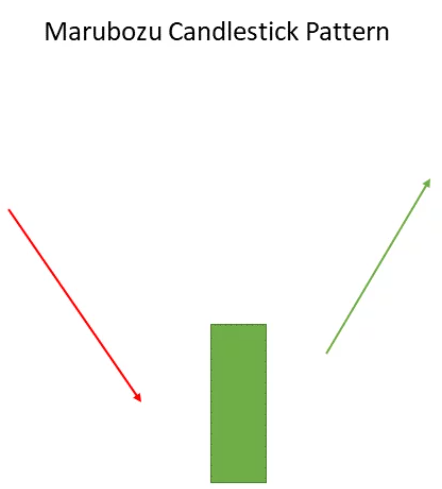
The White Marubozu is a single candlestick pattern that is formed after a downtrend indicating a bullish reversal.
This candlestick has a long bullish body with no upper or lower shadows which shows that the bulls are exerting buying pressure and the markets may turn bullish.
At the formation of this candle, the sellers should be caution and close their shorting position.
There are some days one side wins hence the formation of the marubozu candlestick. Greed and fear move markets when stock trading. we as traders think we’re trading the movement of price. In reality, we’re trading the emotions of other people.
The invention of candlestick charts allows us to gauge how people from around the world view the market. When we have a handle on what other traders are feeling, we can use that to our advantage.
A bullish formation, White Marubozu is formed when price action suggests that the bulls have dominated the trade from start to the end of session. Since the bulls have dominated the whole trading day, there is a high probability that in the short-term, further upward movement might be witnessed at the counter.
Appearance of White Marubozu after a long phase of southward or sideways movement should alert a trader and that particular stock should be brought up on the trading screen for a possible long trade.
The white marubozu candlestick is a tall white candle with no shadows. It suggests a continuation of the existing price trend but only 56% of the time. Thus, be prepared for the price to reverse direction before the breakout or soon thereafter. The frequency rank is high enough, 27, where 1 is the most popular, that you should have no trouble finding this candle in a historical price series. The overall price performance rank is a distant 71 where 1 is best. Thus, do not look for price to breakout and then make a huge move. That could happen but the odds are against it.
The best average move 10 days after a breakout belongs to a bear market where price drops 4.79%. I consider moves of 6% or more to be wonderful, so this falls short. The best performance rank is 26 and that occurs after a downward breakout in a bull market. I think that with many single candle lines, expecting a huge post breakout performance just isn’t in the cards.
Understanding the Marubozo
The name Marubozo comes from the Japanese word for “close-cropped”, indicating a candle with no shadow. The defining characteristic of the Marubozo on a chart is the absence of upper or lower shadows, meaning the chart does not extend beyond the opening day price range. On an up day, the opening price is equal to the day’s low, and the closing price is equal to the day’s high. On days that the stock has gained, it is indicative of a bull market, and on days that it has lost, it is indicative of a bear market.
Gaining days, or up days, strongly indicate that there is a greater demand for the stock than there is a supply. Or at least a greater demand for the stock than there is a willingness to sell it. The opposite can be said on losing, or down days.
Candlestick charting has been popular since the days of Japanese rice merchants and rice traders. They referred to the wide part of the candlestick as the real body, and they would use it to determine whether the closing price had risen above or fallen below the opening price.
When a Marubozo type of candle is found in an uptrend, it is used to signal that the bulls are aggressively buying the asset and it suggests that the momentum may continue upward. The bullish Marubozo candle (open equals low, high equals close) can signal a reversal when it is found at the end of a downtrend because it shows that the sentiment has changed and that the bulls are likely to continue pushing the asset higher. On the other hand, a bearish Marubozo found in a downtrend (open equals high, low equals close) can signal further selling pressure, especially if found at the top of an uptrend.
By ~ Capital Varsity

