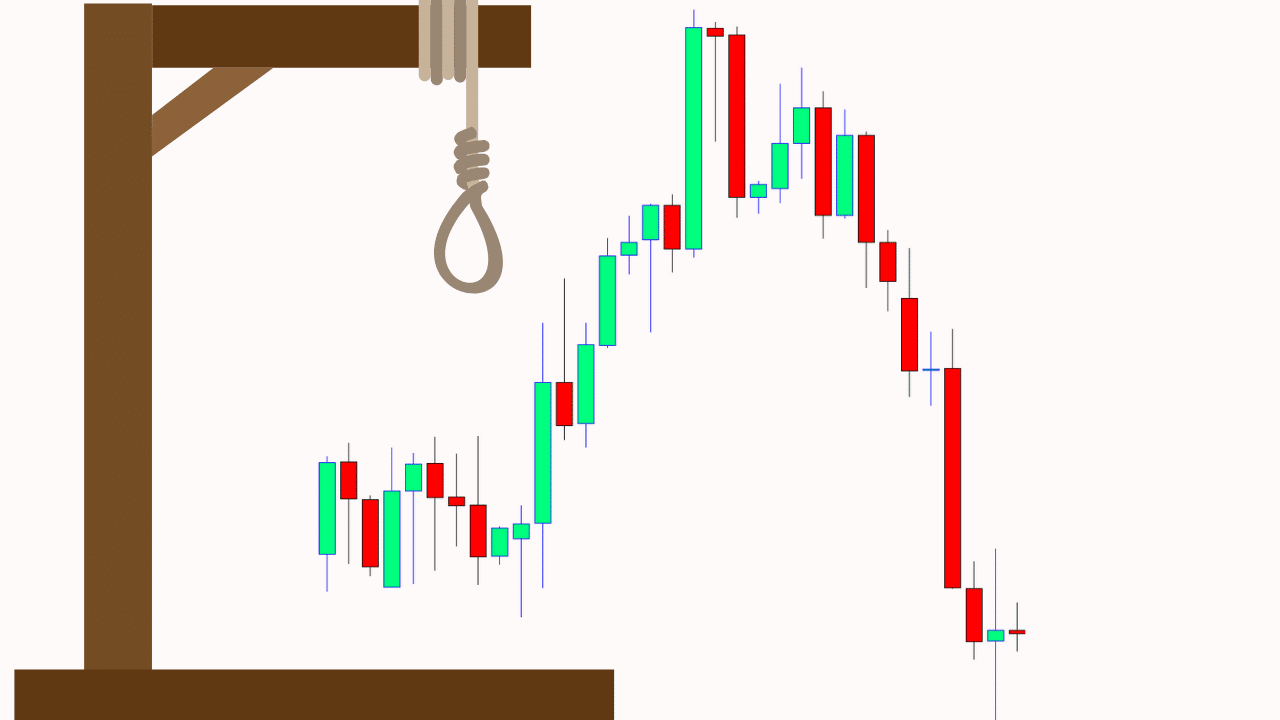
The Hanging Man candlestick pattern, as one could predict from the name, is viewed as a bearish reversal pattern. This pattern occurs mainly at the top of uptrends and can act as a warning of a potential reversal downward. What happens on the next day after the Hanging Man pattern is what gives traders an idea as to whether or not prices will go higher or lower. It is important to emphasize that the Hanging Man pattern is a warning of potential price change, not a signal, by itself, to go short.
The Hanging Man formation, like the Hammer, is created when the open, high, and close prices are roughly the same. Also, there is a long lower shadow, which should be at least twice the length of the real body.
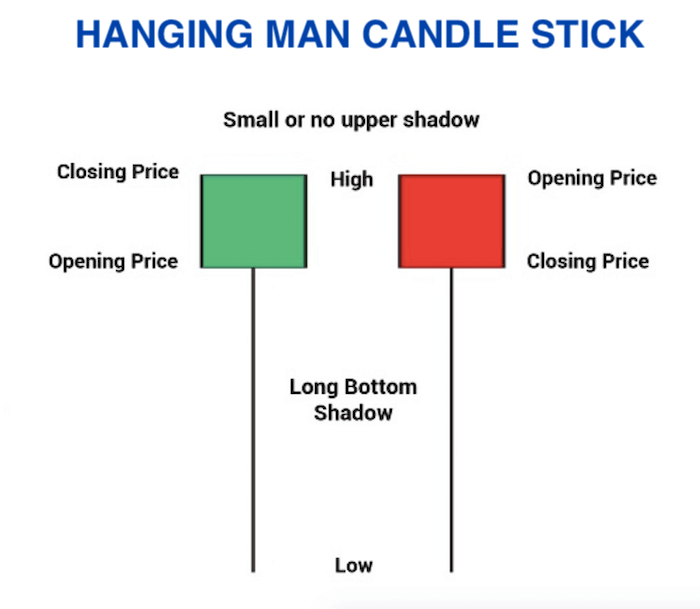
Red vs Green Hanging Man, When the high and the open are the same, a red bearish Hanging Man candlestick is formed. This pattern is considered a stronger bearish sign than when the high and close are the same, forming a green Hanging Man. Although the green Hanging Man is still bearish, it’s considered to be less so because the day closed with gains.
Why Is a Hanging Man Pattern Bearish? After a long uptrend, the formation of a Hanging Man is bearish because prices hesitated by dropping significantly during the day. Granted, buyers came back into the stock, future, or currency and pushed prices back near the open. However, the fact that prices fell significantly shows that the bears are testing the resolve of the bulls.
The color of the real body of the hanging man is not important. There must be a small real body and a long lower shadow. The lower shadow must be at least two times, preferably three times the length of the real body, The market opens at its high, and bulls are in control. But during the trading session, the bears gain dominance and push down the price. The bulls regain the upper hand and push the price up. Sometimes they will succeed in pushing the rice to close higher than the open, other times though they eventually dominate they will not succeed in pushing the price to close above the open. In either case, a small real body is formed.
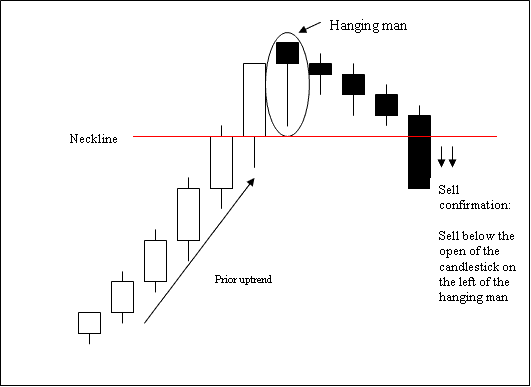
The hanging man patterns that have above-average volume, long lower shadows, and are followed by a selling day have the best chance of resulting in the price moving lower. Therefore, it follows that these are ideal patterns to use as a basis for trading.
Upon seeing such a pattern, consider initiating a short trade near the close of the down day following the hanging man. A more aggressive strategy is to take a trade near the closing price of the hanging man or near the open of the next candle. Place a stop-loss order above the high of the hanging man candle. The following chart shows the possible entries, as well as the stop-loss location.
One of the problems with candlesticks is that they don’t provide price targets. Therefore, stay in the trade while the downward momentum remains intact, but get out when the price start.
By ~ Capital Varsity